Using Japanese Candlestick Patterns
How To Trade Forex With Japanese Candlestick Patterns
Most candlestick patterns form over 1-3 days, which makes them short-term patterns that are valid for 1-2 weeks. Hammers and shooting stars require just one day. Engulfing patterns, piercing patterns and dark cloud cover patterns require two days. Morning stars and evening stars require three days.
Keep in mind that these candlestick patterns are trying to reverse an existing trend, usually a short-term trend that is a few weeks old. Bullish candlestick patterns form in short-term downtrends, while bearish candlestick patterns form in short-term uptrends. Do not expect a long-term trend reversal from a candlestick pattern. More likely, a candlestick pattern may establish support/resistance or signal the start of a pullback or bounce.
What are the Japanese Candlesticks?
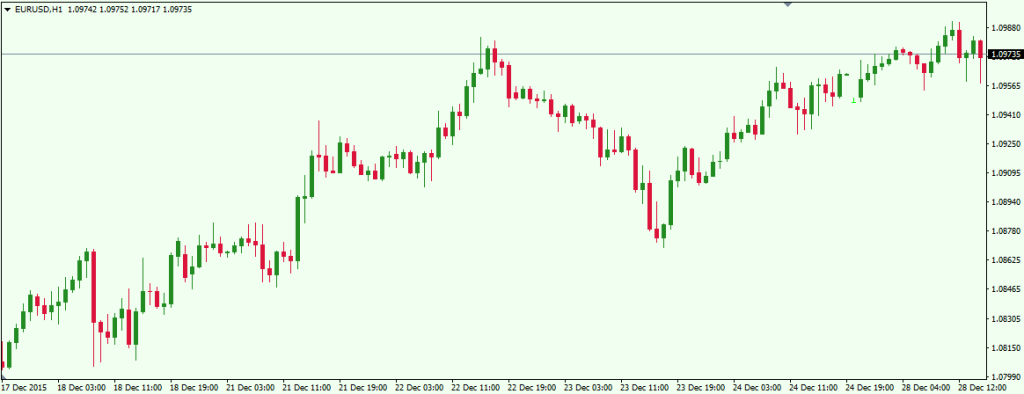
Japanese candlesticks is a visual form for displaying charts invented in the 18thcentury by a Japanese rice trader named Munehisa Homma. They differ from bar charts and line charts, because they give more information and can be more easily read. Let’s take a look at the image below:
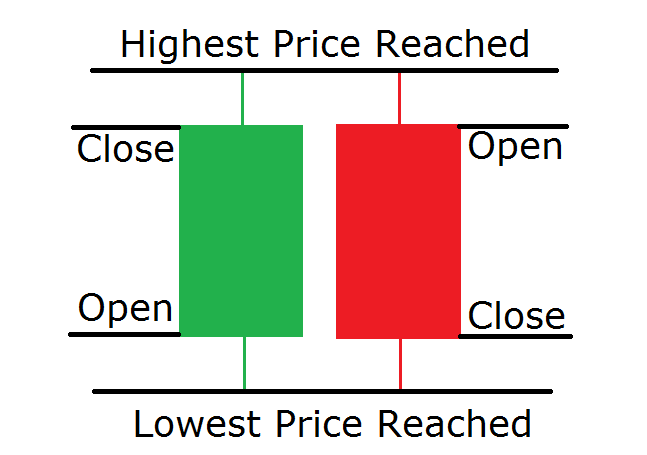
This simple sketch points out all the information a Japanese candlestick will give you. The two candles displayed are a bullish (green) and a bearish (red) candle. Each candle shows the price at which the candle (the time frame) was opened, the price at which the candle was closed, the highest and the lowest price reached. Note that the bearish candles (red) move downwards, so “close” and “open” places are switched. Now look how Japanese candlesticks looks on a price chart.
How to use Japanese candlesticks?
A Japanese candlestick chart provides the trader with crucial information about price action at any given point in time. Traders often confirm their signals with Japanese candlestick patterns, improving the odds of success on a trade.
Trading price action using candlestick analysis alone is a very common trading technique. Yet, candlestick trading tends to be the most powerful when confirmed with additional indicators or when combined with Support & Resistance!
Candlestick patterns in Forex are specific on-chart candle formations, which often lead to certain events. If recognized on time and traded properly, they can assist in providing high probability setups.
Forex candlestick patterns are classified within two types – candlestick continuation patterns and candlestick reversal We will now go through the most common reversal and continuation patterns and we will discuss their potential.
Single Candlestick Patterns
-
Doji (reversal / indecision)
Doji is a very easy to recognize candlestick. We have a Doji whenever the price closes at the exact same level where it has opened. Thus, the Doji candle looks like a dash with a wick.
Note that sometimes there are cases when the price doesn’t move at all from the opening. In these cases the Doji candle is simply a dash with no wicks. Take a look at this image:
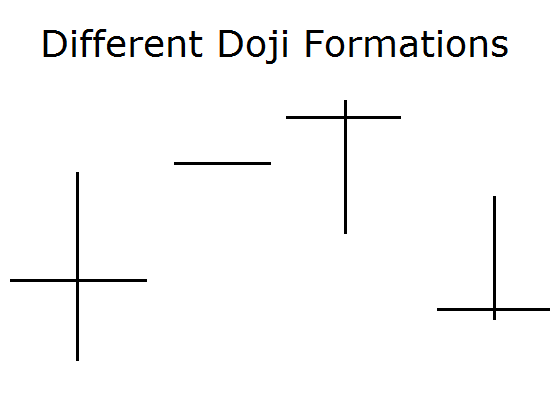
The Doji candle has a reversal character when it is formed after a prolonged move. The reason for this is that during a bullish (or bearish) market, the occurrence of a Doji candle indicates that the bulls are losing powers and the bears start acting with the same force.
Thus, the candle closes wherever it was opened. Just remember: when you get a Doji on the chart after a prolonged move, there is a chance that the price will reverse its direction.
-
Spinning Tops (undefined)
This candle could be bearish and bullish. It has a very small body and longer upper and lower candle wick, which have approximately the same size. Have a look at the image below:
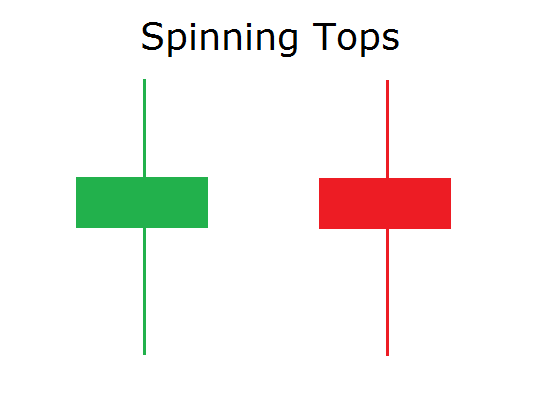
The Spinning Tops have undefined character.
The reason for this is that this candle indicates that buyers and sellers are fighting hard against each other, but none of them could gain dominance.
Nevertheless, if we get this candle on the chart during a downtrend, this means that the sellers are losing steam, even though buyers cannot prevail.
-
Marubozu (continuation)
This is another easy to recognize candle. The Marubozu candlestick has a body and no candle wick as shown below:
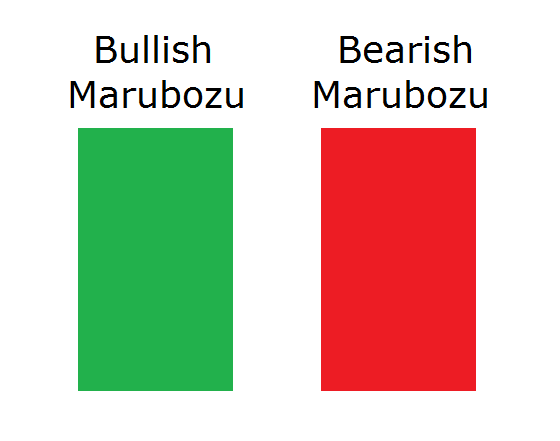
The Marubozu candle is a trend continuation pattern. Since it has no wicks, this means that if the candle is bullish, the uptrend is so strong that the price in the candle is increasing and never reaches below the opening of the bar
-
Hammer and Hanging Man (reversal)
The Hammer candle and the Hanging Man candle have small bodies, small upper wick and long lower wick. These two candles look absolutely the same. Here they are:
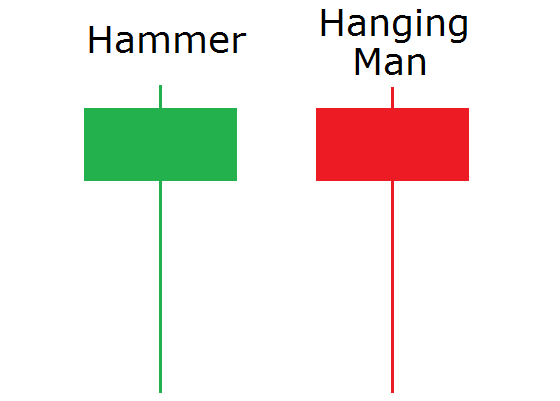
These two candles are classified as reversal patterns. The difference between them, though, is that the hammer indicates the reversal of a bearish trend, while the hanging man points to the reversal of a bullish trend.
-
Inverted Hammer and Shooting Star (reversal)
The Inverted Hammer and the Star are the mirror images of the Hammer and the Hanging Man. They have small bodies, small lower candle wick and long upper wick as shown below:
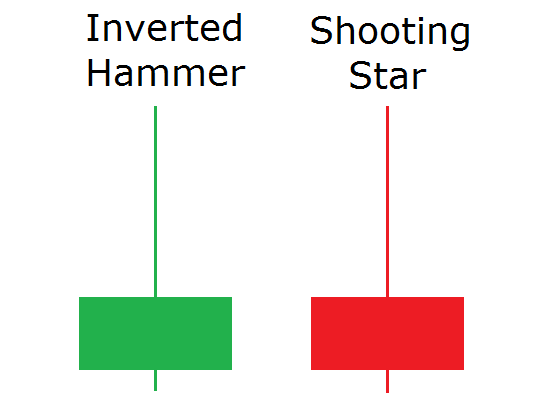
The Inverted Hammer and the Shooting Star both exhibit reversal behavior, where the Inverted Hammer refers to the reversal of a bearish trend, while the Shooting Star indicates the end of a bullish tendency.
Double Candlestick Patterns
-
Bullish and Bearish Engulfing (reversal)
The Bullish Engulfing is a double bar candlestick formation, where after a bearish candle we get a bigger bullish candle. Respectively, the Bearish Engulfing consists of a bullish candle, followed by a bigger bearish candle. Have a look at this image:
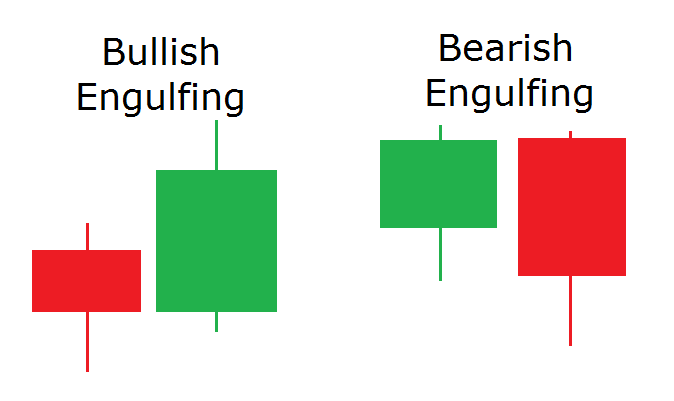
The two forex candles indicate trend reversal. In both the Bullish and Bearish Engulfing pattern formation the second candle engulfs the body of the first. The Bullish Engulfing indicates the reversal of a bearish trend and the Bearish Engulfing points the reversal of a bullish trend.
-
Tweezer Tops and Bottoms (reversal)
The Tweezer Tops consist of a bullish candle, followed by a bearish candle, where both candles have small bodies and no lower candle wick. The two candles have approximately the same parameters.
At the same time, the Tweezer Bottoms consist of a bearish candle, followed by a bullish candle. Both candles have small bodies and no upper candle wick as shown in the image below:
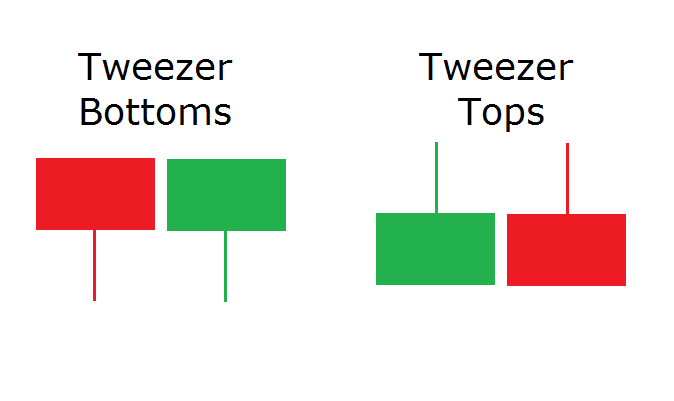
As we said, the two candles of the Tweezers have approximately the same size. Both candlestick patterns have reversal character. The difference between these two formations is that the Tweezer Tops signal a potential reversal of a bullish trend into a bearish, while the Tweezer Bottoms act the opposite way – they could be found at the end of a bearish trend, warning of a bullish reversal.
Triple Candlestick Patterns
-
Morning Star and Evening Star (reversal)
The Morning Star candlestick pattern consists of a bearish candle followed by a small bearish or bullish candle, followed by a bullish candle which is larger than half of the first candle.
The Evening Star candle pattern is the opposite of the Morning Star pattern. It starts with a bullish candle, followed by a tiny bearish or bullish candle, followed by a bearish candle which is bigger than half of the first candle. The image below will illustrate the two formations:
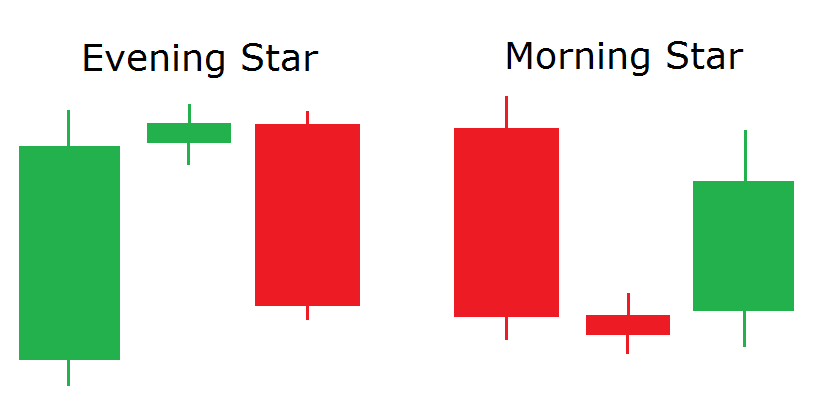
Both of these candlestick groups have reversal character, where the Evening Star indicates the end of a bullish trend and the Moring Star points to the end of a bearish trend.
-
Three Soldiers (reversal)
The Three Soldiers candlestick pattern could be bearish or bullish. The Three Bullish Soldiers consists of three bullish candles in a row:
- A smaller bullish candle
- A bigger bullish candle, which closes near its highest point
- An even bigger bullish candle, which has almost no candle wick
At the same time, the confirmed Three Bearish Soldiers should have the following characteristics:
- A smaller bearish candle
- A bigger bearish candle, which closes near its lowest point
- An even bigger bearish candle, which has almost no candle wick
The image below displays a valid Three Bullish Soldiers and Three Bearish Soldiers:

The Three Soldiers candlestick pattern has a reversal character.
The Three Bullish Soldiers candlestick pattern can end a bearish trends and can bring about a new bullish movement. At the same time the Three Bearish Soldiers could be found at the end of bullish tendencies, signaling an upcoming bearish move.
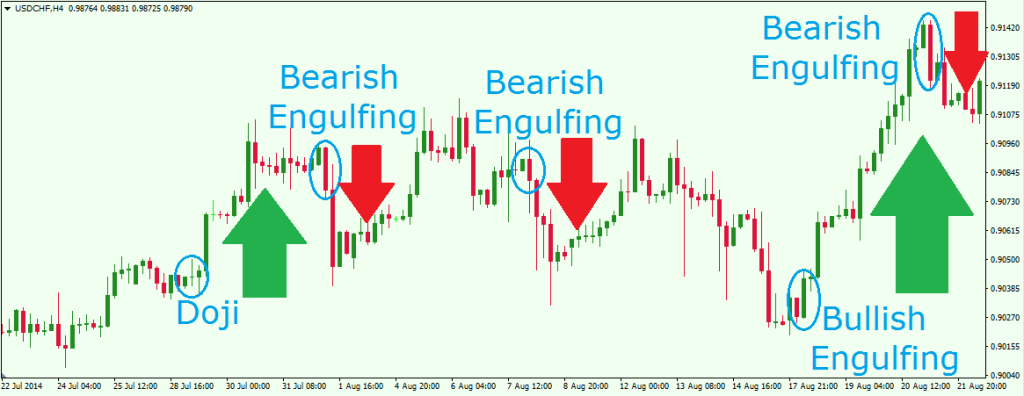
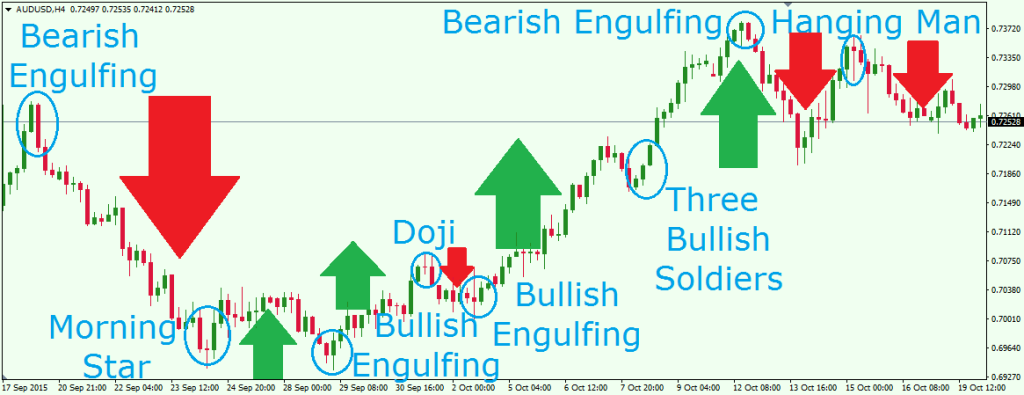
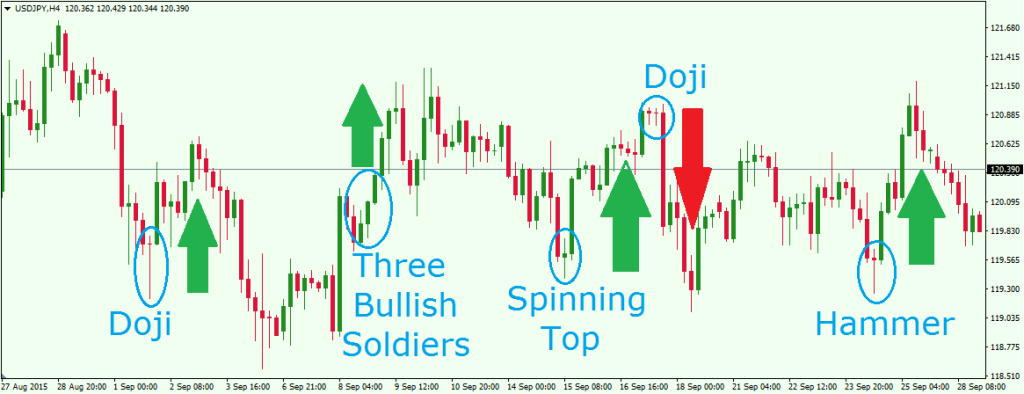
Candlestick Chart Analysis
Now that we have gone through some of the more reliable candlestick patterns in Forex trading, we can now see how some of these patterns look on a price chart and how we can use them as part of a forex strategy.
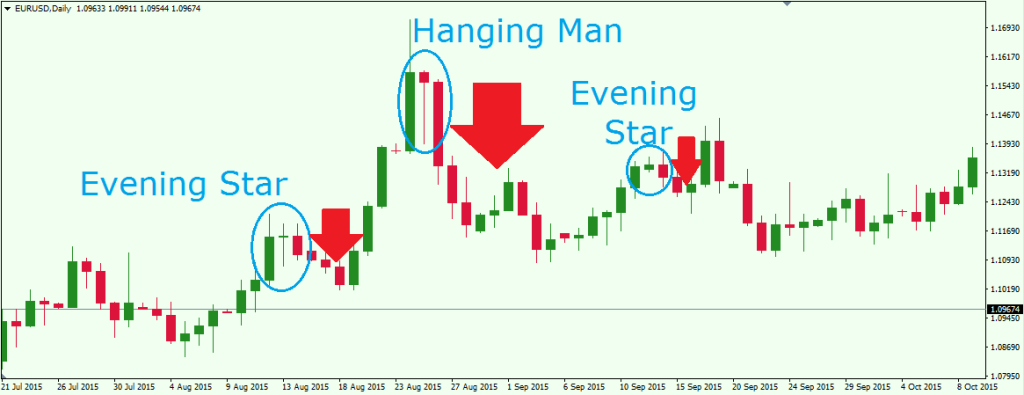
: